


Determining the Best Valorant Professionals by Using the Power of Analytics
Let’s use data and analytics to see how the pro players perform in terms of Average Combat Score and Kills Per Round
Let’s use data and analytics to see how the pro players perform in terms of Average Combat Score and Kills Per Round
In the world of Valorant statistics, it is easy to take a bunch of numbers and crunch them to some conclusion. They are used in every aspect of the game: casting, team analysis, article writing or viewer experience. There are many different methods of analysis we can use to confirm suspicions or refute claims.
Let’s use these math tools and ideas and look at ACS and KPR in pro play. What is the general trend of players overall? We used rib.gg to gather all the data that we discuss in the next sections below.
One major data tool is a bell curve. When discussing the scene in terms of metrics, one’s intuition would probably go to the bell curve (also known as the Normal Distribution):
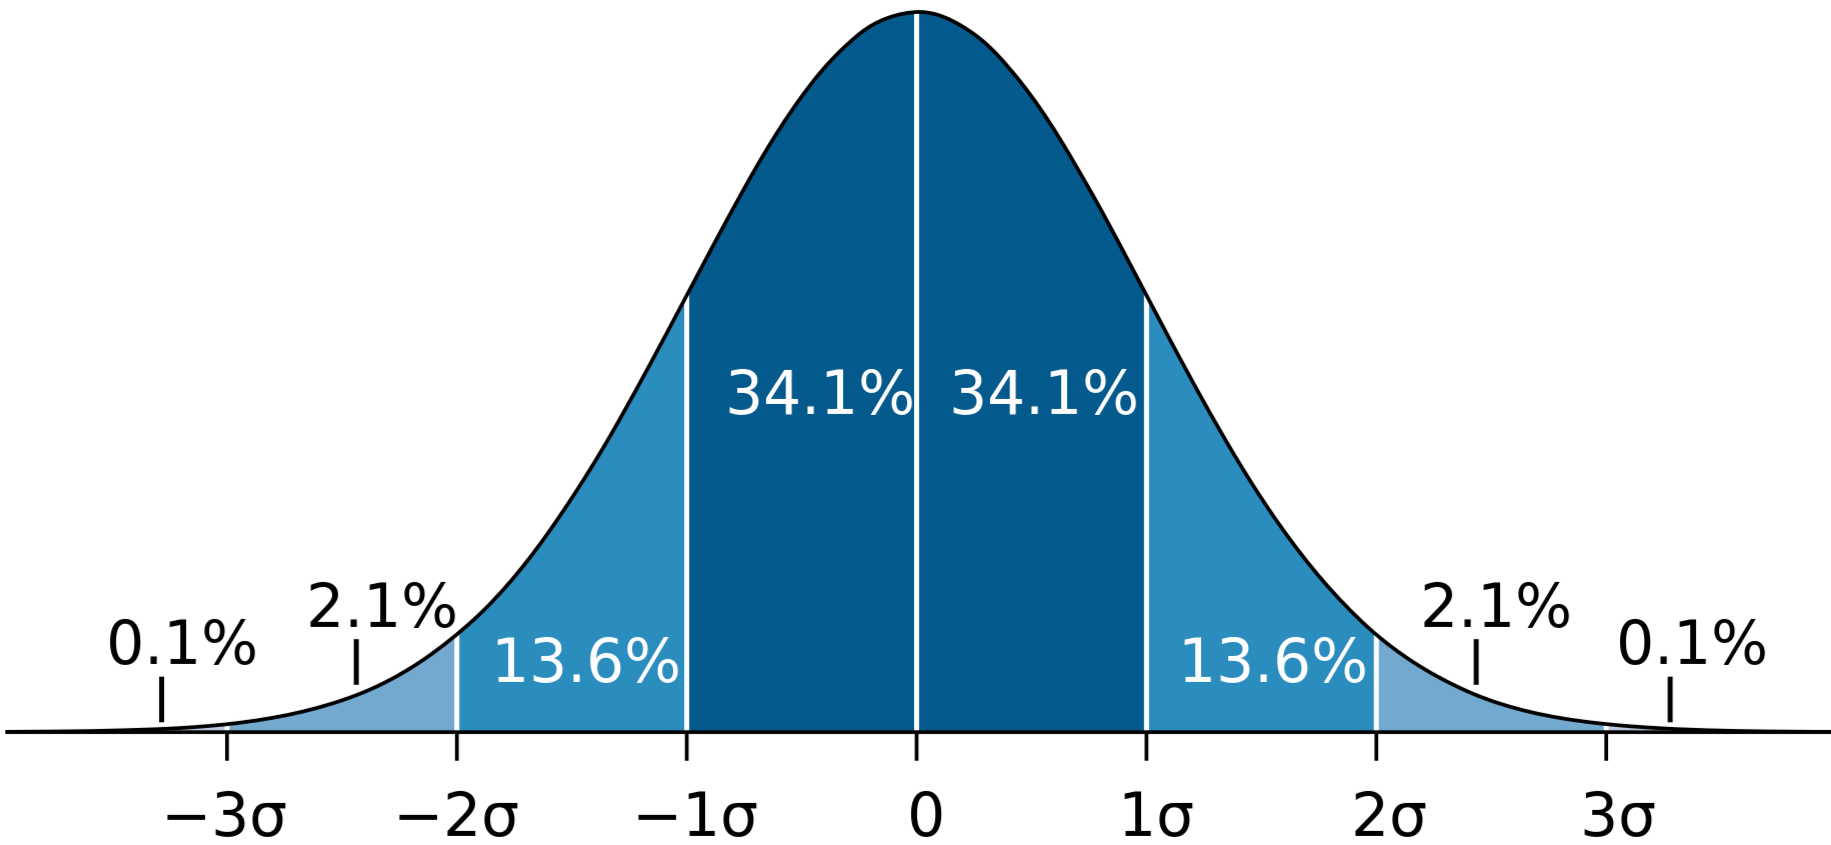
Intuitively, this would make sense. There are those who perform poorly, and those who perform stupendously, but the majority of people stand in the middle. However, is this an accurate representation of the spread of pro players in Valorant? Let’s find out by starting with a commonly used stats, the Average Combat Score.
In terms of general usage, ACS can be pretty hit or miss. In a previous article, we discussed how it is calculated and what impacts your ACS. However, when used to compare Duelists or Initiators, it is a pretty decent metric. Here is all the ACS data from May 2022:
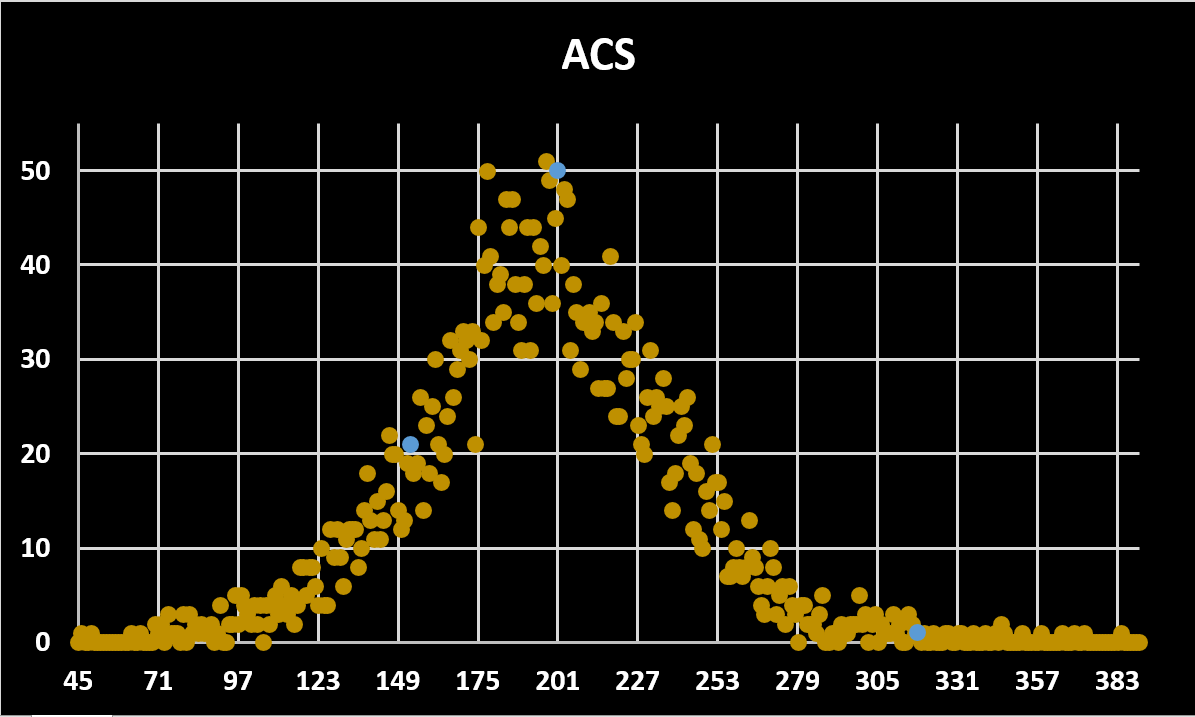
The three highlighted dots, just for a form of reference are:
rDeeW [ORDER - OCE] with 318 ACS
Seven [TSM - NA] with 201 ACS
Avova [G2 - EMEA] with 153 ACS
Instead of focusing on individual players, let’s look at the trend and pattern. Similar to a Bell Curve, right? Now, one trick that many statisticians use to sort of “cheat” the system is that if it LOOKS like a normal curve, it probably is a normal curve. To avoid any unnecessary theory, the general idea is that, as we gain more and more data, many other probability distributions actually approach the Normal Distribution. Put another way, the more stuff we have, the more it’ll look like a bell curve. Here is a Normal Approximation of our ACS Data:
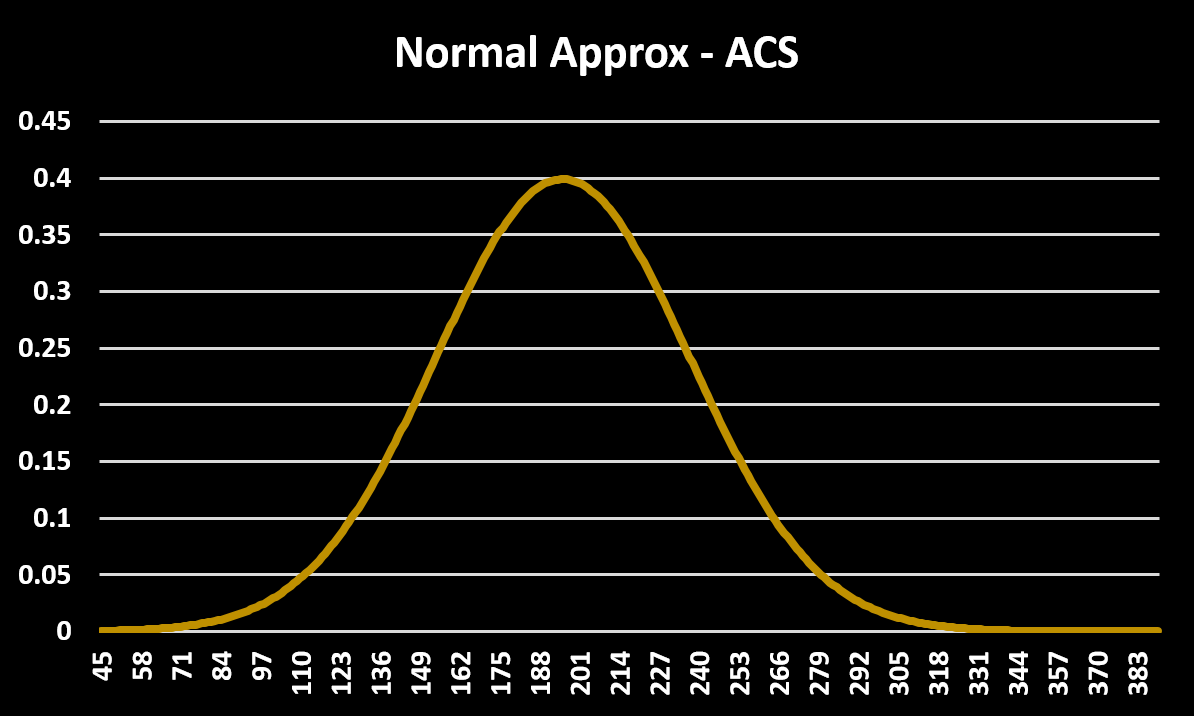
A Normal Distribution is the best possible outcome for any data set, because it has several nice properties, one of which is spread approximation. For those who took stats in high school or college/university, you may know this as a z-table or empirical rule. Again, skipping unnecessary theory, we can, essentially, calculate the amount of the pro-player base that is above or below a player, simply by knowing the player's ACS.
For example: rDeeW’s ACS is better than 99.8% of the pro-player base. Seven’s is better than 55.1% and AvovA’s is better than 15.1%.
This can also work where we can provide a range, then make inferences about that range. For example, about 68.2% of pro players have an ACS between 154 and 237, and about 95.4% of pro players fall between 113 and 279 ACS.
Another nice property is that the calculated mean is a flat 50% of the data (again skipping a lot of theory here). So, the mean calculated here was 196. You can sort of gauge where a pro player lies based on just that alone.
So who has the highest ACS? That prize goes to Yue from Korea playing for Griffin Esports Academy with 384 ACS, better than 99.9997% of the players!
For fun, let’s consider another common stat: Kills per Round. When we map the data, we again see a normal curve, helping us see what the average, top and bottom performers look like.
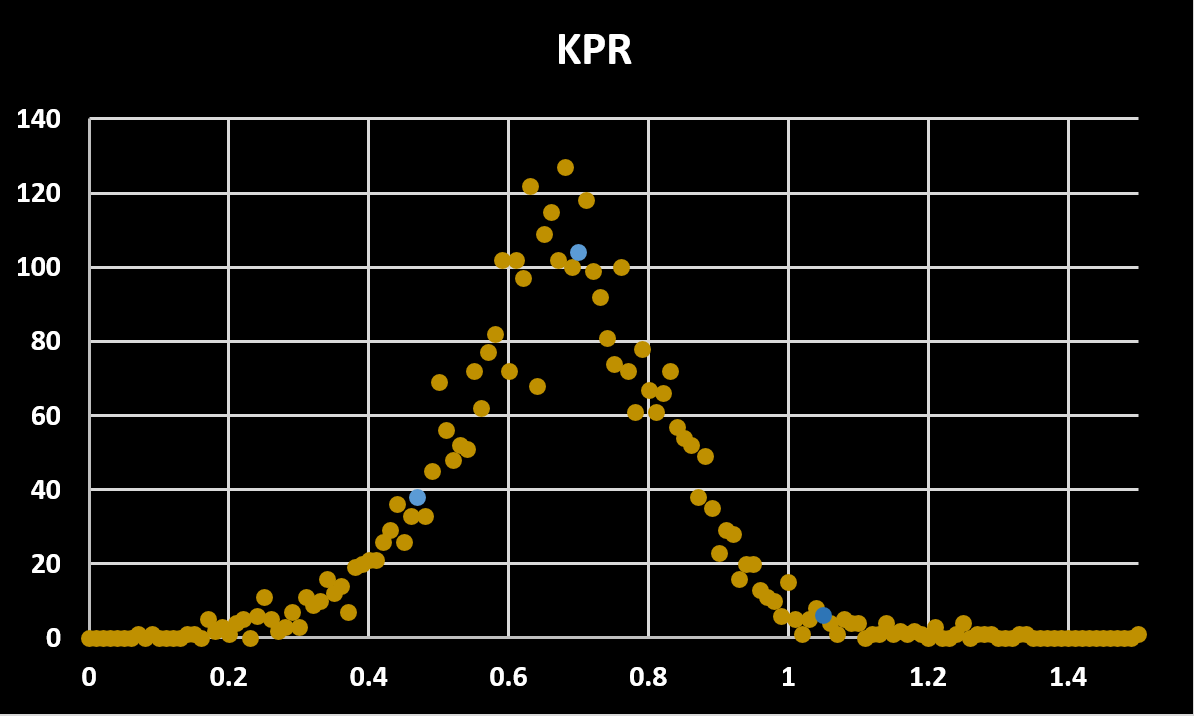
The three highlighted dots, just for a form of reference are:
Alfajer [Fnatic - EMEA] with 1.06 KPR, better than 99.2% of pro-players
Apoth [Evil Geniuses - NA] with 0.7 KPR, better than 57.1% of pro-players
Esperanza [DAMWON Gaming - KR] with 0.47 KPR, better than 10.6% of pro-players.
The mean value is 0.67 KPR, meaning that the average player gets about 2 kills per 3 rounds. So if you’re doing better than that in your games, good job!
For reference, here is the normal approximation of that curve.
So who has the highest KPR? Same as with ACS, this award goes to Yue from Korea playing for Griffin Esports Academy with 1.5KPR, better than 99.9998% of the players!
From ACS, getting 250 ACS on average or above is incredibly difficult. A pro player who has 250 consistently is better than 90.5% of the pro player base. This really speaks to how powerful a consistent top fragger can be for a team.
Simply put, the way that pro-players are spread out is in a simple and easy manner. We can any pro player, like the ones mentioned above, and easily compute how they compare to other pros using a Normal Distribution (or a z-table). In general, pro players have an ACS between 113 and 279. So a player that has 300 ACS or above or 100 ACS or below should really stick out to the viewer, as they are a rarity (only 4.6% fall into this category).
From KPR, we can see how rare having a 1.0 KPR really is. Considering most games span 20-24 rounds (ignoring OT), this means that getting a little over 20 kills in a game is exceedingly rare. Based on the data and the approximations given, having 1 kill per round overall means that the player is better than 97.9% of pro-players.
This also lets us see who is better, and by what percent. For example, if I told you Alfajer’s KPR (1.06) and Apoth’s KPR (0.7), there could only be so much one could gain from that. However, using the distribution we found, we can easily see that Alfajer’s KPR is much more impressive, being above 99.2% of players, whereas Apoth’s is only above about 57.1% of players. That is a lot bigger of a gap than one might have guessed and speaks to Alfajer’s impressive abilities.
For me, I would be interested to see where this would go after. What other stats can be analyzed in a similar manner? Would they also be bell curves? And what implications are there? Does placing higher on the bell curve imply a higher win rate? Or maybe being higher on a bell curve implies that your team depends on you more.
Stay tuned for more analytical stories!


